Quantcast
Channel: Software – Evil Mad Scientist Laboratories
Viewing all 32 articles
Browse latest View live

AYAB v0.90 is here!

$
0
0

AYAB (all yarns are beautiful) Logo

The All Yarns Are Beautiful project has just released a new version of the AYAB software, v0.90!

It’s a bugfix-release, that means it fixes mostly known issues and no additional features are introduced. This is necessary to get more stability in the software and to have solid foundation for future developments.

If you’re using our AYAB Interface, we’d encourage you to upgrade. If you want to contribute to this project that brings new life to old Brother knitting machines, head over to the announcement to read more.


AxiDraw and TouchDesigner

$
0
0

We’ve noticed a few artists on twitter and instagram using TouchDesigner as a tool in their workflow toward creating output with AxiDraw.


David Braun has been posting beautiful, and sometimes mindbending artwork on twitter.


Chris Hall posted this piece using sound waves to create scenes.

Some like it plot . . . . . #inktober #axidraw #touchdesigner

A post shared by Hard Work Party (@hardworkparty) on


Noah Norman has been posting geometric plotting videos.

#axidraw #touchdesigner

A post shared by Matthew Ragan (@raganmd) on


Matthew Ragan has been taking advantage AxiDraw’s ability to draw on just about anything, and plotting over already printed materials. He also has published his tools on github for getting vectors out of TouchDesign. He describes it as:

A pipeline for handling the SOP to SVG pipeline. This is especially handy for using procedurally generated geometry for paths to be cut or plotted.

We’ve added a link to his repository on the AxiDraw documentation wiki. We love it when folks share their tools and would love to hear what tools and processes people are using or creating for working with our plotters.

Using the WaterColorBot to teach programming

$
0
0

Water color painting titled Ocean Woman
JR has been volunteering in a high school programming class and wrote up a thoughtful post about his experiences using the WaterColorBot in the classroom. He wrote a Python library that allows users to directly control a WaterColorBot by writing Python code.

To be honest, this library is a pretty insane way to control the bot. It’s needlessly low-level: you’re manually controlling the brush’s position, you’ve got to remember to wash and re-ink the brush every so often, etc. If your main goal is to just get the bot to paint a pretty picture, there are lots of better ways to go about it.

As a teaching aid, though, it’s been a total success, because it lets students flex their burgeoning Python skills and actually make a real thing in the process! We’ve been blown away by the stuff our students have created.

He has also documented and shared his code on github.

AxiDraw, JavaScript, and Generative Art

$
0
0

Matt DesLauriers published a two-part blog post, Pen Plotter Art & Algorithms exploring his JavaScript workflow with AxiDraw and generative art.

Unlike a typical printer, a plotter produces prints with a strangely human quality: occasional imperfections arise as the pen catches an edge or momentarily dries up, and the quality of the ink has the subtle texture and emboss that you normally only see in an original drawing.

He has also posted his source code on github for the articles.

Part 1 covers getting started and explores Delaunay triangulation. Part 2 delves deeper into developing algorithms.

Featured artist: Sash Zats

$
0
0

Sash Zats is a designer and generative artist working with AxiDraw. You can find him on instagram and twitter. One of the things about Sash’s work that I enjoy is his choices of materials. He often uses bold papers and subtle pen colors to bring his designs to life.

The sun and the moon

The Sun and the Moon are a compelling pair of drawings with gold and silver ink on black. The rich texture of the overlapping lines almost looks like textile work rather than ink.

maps on white

In describing these map drawings, Sash says:

For my dad’s 65th birthday I plotted places that are significant for our family.

maps on black

Continuing in the tradition of tool sharing that we have seen in generative artists, Sash included information about how he created the drawings, starting with calculating tile indices from coordinate bounds, parsing vector tiles protocol buffers, and converting to vectors before plotting with the AxiDraw.

Manhattan drawing

In a similar vein, this drawing of Manhattan buildings, blocks and neighborhood used data from NYC OpenData. Sash outlined his process for this one:

• data from NYC OpenData using httpie to filter unrelated data with
• process using #swift Xcode Playgrounds
• generate 3D geometry using #SceneKit
• export to .stl (.dae crashes #blender)
• export to SVG using Freestyle SVG to maintain occlusion
Svg Spatial Sort to optimise SVG for faster plotting
• plot using #axidraw v3 plotter

He published his Manhattan model as well.

Penrose tiling

Sash posted this Interrupted Penrose tiling with a link to Penrose’s lecture on tiling.

Anatomical heart of triangles

Delaunay triangulation is a familiar tool for generative artists, and is used in a series of drawings, including this anatomical heart drawn in white on bold red paper.

Drawing of a protein

The last picture I want to share is of the protein 5B0R, which Sash says, “when plotted looks like a badass graffiti.” I enjoy seeing science as an inspiration for art, and while I’ve seen a couple of artists plot proteins, the combination of the teal paper and light ink on this one give it a completely different perspective.

Thank you, Sash, for sharing your photos and processes! You can find more of his work, including videos of the drawing process on instagram and twitter.

New AxiDraw Software v 2.5

$
0
0

We’re pleased to announce the release of the latest version of the AxiDraw software, 2.5. which includes a number of frequently-requested features that we’ve been working on over the last year.

An expanded user guide

Perhaps foremost, we have updated and greatly expanded the PDF AxiDraw user guide, which covers how to use the AxiDraw, including every part of the software. In addition to sections that go over the new features, we have thoroughly revised the rest, including a larger and clearer section on getting started.

A new SVG optimization tool

In normal use, the AxiDraw software plots elements in the same order that they occur in the file. However, depending on how your file was generated, that may not be the most efficient way to do things. If the order of the elements in the file is poor enough, the plot time can actually be dominated not by writing and drawing time, but by pen-up movements (illustrated here in red) between objects.

We’ve written a new SVG ordering utility, that can sorting of objects in an SVG document, re-ordering them as needed to reduce pen-up travel. It’s also a layer-aware and group-aware sorting tool, that can process a full document and reorder elements on each layer of the document and either respect or break apart other groups in your document. This tool is available in two versions: An individual Inkscape extension as well as an integrated version that you can use automatically within the AxiDraw software.

Better support for using multiple machines

The new AxiDraw software supports assigning names to individual AxiDraw units over USB, which you can use as semi-permanent labels when printing to a particular machine. You can also now plot to a specific AxiDraw, or simultaneously plot the same document to a number of connected machines.

A new version of Hershey Text

This release includes an all-new version of Hershey Text, our software for creating stroke-based text within Inkscape. You can about the new features in our blog post announcing it.

And more!

Amongst other improvements in the new software are the following:

  • Updated to use Inkscape 0.92
  • Paths in the document are now clipped gracefully and precisely at the boundaries of both the artboard (drawing canvas) and machine travel.
  • Supports more SVG object and layout types natively
  • Faster plotting on paths with very high vertex density
  • Online version check added
  • Improves behavior of Hatch Fill extension
  • Bug fixes galore

We recommend this new version to all AxiDraw users; you can download it for Mac, Windows, or Linux, following our guide here.

Hershey Text v 3.0

$
0
0

Some years ago we wrote a neat little Inkscape extension called Hershey Text. Hershey text could take a little bit of text that you would type and render it into stroke fonts, also known as engraving fonts.

We are very pleased this week to release an all-new version of Hershey Text, written from scratch, and far more useful, capable, and extensible. We have a comprehensive user guide for it as well.

Hershey Text v 3.0 will be bundled into future versions of Inkscape, but it’s also included with the new AxiDraw software and available on its own for download today.

A little background

All common computer font formats (TrueType, et al.) are outline font formats. In these, each glyph in the font defines a filled vector shape. That is to say, the visible part of a character in an outline font is the area enclosed by the shape. Fonts like these are appropriate for use in laser printers or other high-resolution devices.

By contrast, an engraving font (sometimes called a “stroke” font) is one where each visible character is defined by the stroke itself, not the area enclosed by it. Fonts like these are usually the best choice for pen plotters, machine tools, and other circumstances where the pen width itself is significant.

Old vs new

The original Hershey Text worked quite well, but was limited in scope. The mechanism for drawing fonts was based on a historic font format that turned out to be quite limiting:

  • As a “custom” (neither proprietary nor standard) font format, there was no readily available font editor that could be used.
  • The font format only supported characters made of straight line segments.
  • The font data was encoded by ASCII character position, and did not support basic international (Latin-1) characters, let alone Unicode.
  • All of the font data was stored in a single large file. This made adding new fonts (even with data available) extremely cumbersome.

Additionally, the function of the original Hershey Text was relatively simplistic: It rendered text that you entered in the text entry box. This left no facility for rendering paragraphs of text, nor for easily working with multiple fonts, sizes, or styles.

Hershey Text v 3.0 aims to resolve all of these issues.

SVG Fonts

First, the new version uses the SVG font format. While this is not a common font format [1], it is a standard, and that fact makes it possible to create and add new fonts with relative ease.  Characters (glyphs) within an SVG font are composed of little SVG drawings, which (in contrast to almost every other modern font format) can natively support stroke fonts.

Migrating to SVG fonts immediately gets us support for font editors, arbitrary shapes within fonts  (not just straight segments), international character and Unicode support, and separate files for the fonts — making it practical to add new fonts.


Replacing text in place

The second major change is that instead of entering text (one line at a time) in the dialog box, the new Hershey Text now converts text in the document, replacing it in place. This brings support for not just paragraphs of text, but also for handling mixed text with different sizes and styles, in whatever way it is laid out on a page.


Automatic font substitution

As an advanced feature, the new Hershey Text supports a subtle means of text substitution. If you have text laid out in a regular (outline) font but also have a stroke font matching the same name as that outline font, then it will automatically use that particular stroke font when Hershey Text is called. This feature makes it possible to preview how text will be laid out in a matching outline font, and also to automatically render into multiple stroke fonts within the same document.


Getting Hershey Text v 3.0

Hershey Text v 3.0 will be included with the forthcoming Inkscape 1.0, which is headed for release later this year. We also have a version for Inkscape 0.92.x, ready for use today.

Hershey Text v 3.0 is now included standard with both the AxiDraw software installers and the EggBot software installers.


You can find current instructions for downloading and installing Hershey Text at our documentation wiki.

Additionally, the PDF Hershey Text user guide is available for download at our documentation wiki. We encourage all users to read through this guide to learn more about how the software works.


Hershey Text v 3.0 is open source software; development and our issue tracker are hosted at gitlab.


[1] The SVG font format — as a stand-alone font format — is essentially obsolete. More or less, no one is using stand-alone SVG fonts. However, SVG fonts are perhaps surprisingly alive, thanks to emoji. The SVG font format has actually been enshrined within OpenType, and OpenType fonts can contain an “SVG font table”, which is simply a font constructed according to the SVG 1.1 font format. Fonts of this spec are called “OTF+SVG” fonts, and typically intend that when client software cannot display a given character in the SVG table, it will fall back and display a TTF alternative. The neat thing about OTF+SVG is that in addition to having stroke-based characters, it can also contain color information — and so this format is sometimes referred to as a “Color Font“. OTF+SVG is supported by Photoshop, Illustrator, Firefox, MS Edge, Pages, Keynote, TextEdit, and others. Because of this, SVG fonts do still exist, even though they aren’t often observed on their own.


The AxiDraw CLI and Python API

$
0
0

Following the release of our new AxiDraw software this week, we are pleased to announce the release of two additional software components that greatly extend the capability of the machine.

The AxiDraw software is now available in two alternate versions that may be helpful for developers or for anyone who would like to control the machine programmatically rather than through Inkscape: A stand-alone command-line interface (CLI) tool, as well as a full-featured Python library.

The AxiDraw CLI

The first new tool is the AxiDraw CLI,  a command-line API to drive the AxiDraw outside of Inkscape. Like the Inkscape-based software, its primary function is to plot SVG files. However, it is a stand-alone utility that can be driven from within shell scripts and other environments that make use of shell commands.

Once installed, plotting a file can be as simple as executing the following command:

axicli filename.svg

There are, of course, a breadth of different modes and configuration parameters available. We have written detailed descriptions of each of these options in our comprehensive API documentation. The CLI also supports the use of configuration files to quickly switch between different sets of parameters.

Since most common scripting and programming environments allow one to call shell commands like this, that allows the AxiDraw to be used directly within a wide variety of frameworks.


The Python API

The second new tool is the AxiDraw Python API. The AxiDraw CLI is written within Python, and we have both exposed and expanded upon that nucleus to create a flexible and powerful Python module, complete with its own comprehensive documentation.

Just like the CLI, the Python API can plot SVG documents; it can both read SVG files and accept strings containing SVG data.

It also has features that are not available within Inkscape or the CLI: It supports direct interactive XY control. You can use absolute or relative moveto/lineto type commands to control the AxiDraw from within your own programs. This is particularly useful for a wide variety of potential AxiDraw applications that are not writing or drawing, but otherwise making use of the AxiDraw as a low-cost motion control platform.


Stroke fonts from Quantum Enterprises

$
0
0

One of the features in our new Hershey Text v 3.0 software is the ability to extend it with new fonts.

One company, Quantum Enterprises, is already selling high quality stroke fonts that are compatible with the new Hershey Text, and ideal for use with the AxiDraw.

Their fonts are available in matched pairs: A TrueType (outline) font and a single-stroke SVG stroke font. The TrueType font works as a regular computer font, which you can use to lay out and edit text on your page. Hershey Text then performs automatic font substitution replacing the text in place with the matching stroke font.

Here is a sample of what one of their regular (TrueType) handwriting-like fonts looks like, as laid out on the page within Inkscape:

And, here is how that same text looks once rendered with Hershey Text into its single-stroke SVG font version:

The single-stroke text comprises a set of paths ideally suited to be traced with a pen. And finally, here is how that stroke text looks as plotted with the AxiDraw:

These new stroke font pairs, as well as custom fonts, are available to purchase directly from Quantum Enterprises.

New EggBot Software Version

$
0
0

We are pleased to announce a major revision for the EggBot software with several significant improvements. It is now updated to support Inkscape 0.92. We have also streamlined the EggBot menu within Inkscape and updated the example set.

We have a new SVG reordering utility, written from scratch. In addition we have improved the Hatch Fill extension, which can now provide neat connections between the endpoints of the hatching, for fast, efficient filling.

We also have a brand new version of Hershey Text, which converts full blocks of text rather than just single lines.

The EggBot documentation has been improved and updated to reflect these changes.

Featured artist: Michael Fogleman

$
0
0

Drawing of lots of small coils titled Spiral Galaxies

Michael Fogleman is an active member of the plotter art community. His twitter feed often contains either new art, or links to new tools that he has made.

He has created and shared some incredible resources, including a wide variety of vector art tools and even an alternate Python library for AxiDraw.

Drawing of a protein diagram displayed at the Plotter People Meetup

I am a fan of science as an art subject, and Michael’s protein ribbon diagram drawings are a great example. A ribbon diagram depicts the 3D structure of the protein as well as the common secondary structures of helixes, strands, and coils.

In addition to making the drawings, he has a twitter bot that publishes ribbon diagrams and has published the code for the project. This ribbon diagram was one that we got to see at the Plotter People meetup in San Francisco.

Drawing of Galaga

Michael hits another of my weaknesses, vintage gaming with his NES Sparklines drawings.

For these drawings, I use an NES emulator (of my own creation) to record a snapshot of the Nintendo’s RAM at each frame (60 fps). The NES only had 2048 bytes of RAM. For each address in memory, I plot its values over time as an individual sparkline. I only show addresses that changed at least once, so there are usually fewer than 2048 sparklines. Because each game developer used the memory in different ways, each game produces its own unique look when plotted.

MOS 6502 processor drawing

He also plotted something dear to our hearts (and close to the heart of the NES), the MOS 6502 processor.


Topographic map of Mount St. Helens

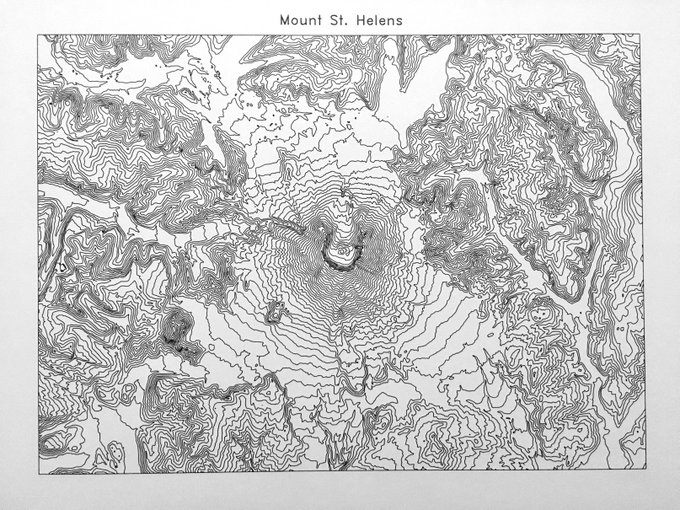
One subject that I’ve often thought appropriate for plotting are maps, and Michael’s topographic maps are elegant. Again, in addition to making drawings, he has provided his code for working with AWS terrain data as well.


Drawings of the Stanford bunny

Michael sells drawings, and accepts commissions for favorite NES games, proteins, map regions, and even cellular automata. He has projects on wide ranging subjects, not limited to pen plotters, so go check them out!

Hidden line removal for AxiDraw

$
0
0

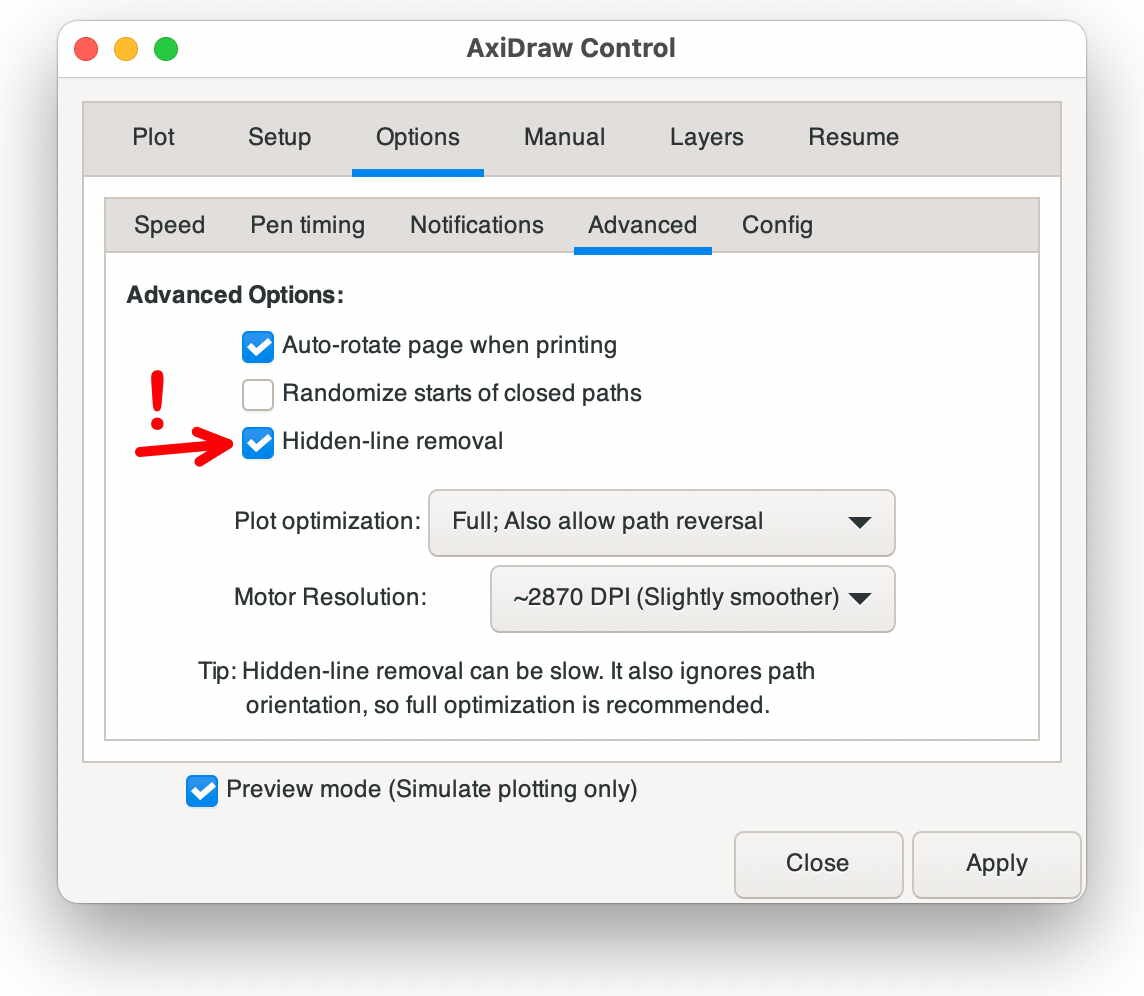
AxiDraw Control v3.9 screenshot, showing hidden-line removal feature

We’re pleased to note the release of AxiDraw software version 3.9 this week, with a couple of neat new features. One of them is that the “preview mode” button — which lets you simulate plotting to see how the results will come out — is now accessible no matter which function is selected. The other, the big one, is that AxiDraw now supports hidden-line removal as a standard feature.

There’s a full changelog up on GitHub, which also notes a few new features for users of the AxiDraw CLI (command-line interface) and AxiDraw Python library, including the ability to resume a plot a little before where it was paused.

But, let’s talk more about hidden-line removal.

Overlapping circles and lines with fill

Above are a couple of objects drawn in Inkscape: Some overlapping circles and open contours. All of these objects have fill properties applied, and all but the middle circle also have a stroke property applied. The stroke shows the thing that we want to draw, and the fills, white or in color, obscure places where we don’t want to draw.

Historically, the AxiDraw software and its antecedents like the EggBot have ignored all fills, and drawn all paths that appear in the document, which will give a plot something like the following, as rendered with the AxiDraw preview mode:
Overlapping circles and lines, showing only the paths, without fills

Now, once you enable the new hidden-line removal option, the plot preview renders as follows:
just the visible paths from the overlapping circles and lines

There is some subtlety to how this works. And, this is a big change, so the feature is off by default. The original behavior is to plot all paths. The new behavior, when hidden-line removal is enabled, is to plot paths only if (1) they do have a stroke applied to them, and (2) they are not occluded behind filled objects. An object that does not have a stroke property will not plot, nor will one hidden behind a solid fill.

Let’s look at a more complex document:
Background of scribbles with assorted shapes hiding parts of the scribbles

This document has a rectangular outline, a background with a grid of regular crisscrossing lines, a heavy layer of scribbles above that, and then white shapes over that background, with a border inset into each white shape. It also has an outer “frame” that clips the scribbles to stay within the rectangular outline.

With hidden-line removal disabled — when only the outline and inset border of those white shapes is drawn — that previews as follows:
Just a giant mass of scribbles

Here, it is barely possible to make out the original shapes. If you look closely, you may be able to see those shape outlines and borders, but they are essentially lost in the scribbling.

But now, turning on hidden-line removal and plotting the document, we get the following neat result:
Background of scribbles with assorted shapes hiding parts of the scribbles, in blue ink

This plot was drawn on paper with a ballpoint pen. A couple of paths on this plot, the outer rectangular frame and the borders into the white shapes, were plotted with several passes of the pen in order to get darker paths on those parts alone.

AxiDraw software 3.9 is available now on our documentation wiki. The hidden-line removal feature is also available using the “hiding” option in both the AxiDraw CLI and Python API.

Viewing all 32 articles
Browse latest View live